A data-driven look at PFAS contamination across the state
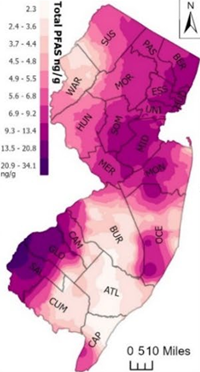
Statewide PFAS Overview Map
📌 “Where is PFAS found in New Jersey?”
Using publicly available datasets from NJDEP, EPA, and national PFAS monitoring programs, the map highlights:
- Public water systems with PFAS detections
- Systems exceeding New Jersey’s MCLs
- Contamination hotspots near industrial sites, landfills, and airports
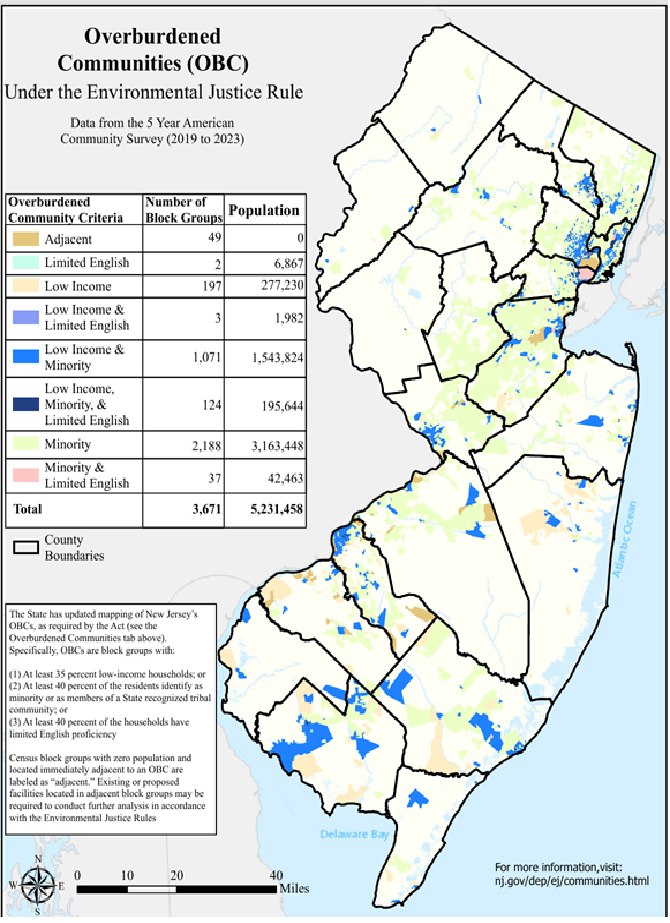
- Communities with elevated environmental justice concerns
- PFAS concentrations across the state
The highest total PFAS levels (combined concentrations of 40 monitored compounds) are found along the Interstate 95 corridor—from the industrial NY/NJ metro area in the northeast to the Philadelphia suburbs in the southwest. This pattern reflects a long history of manufacturing, chemical production, firefighting foam usage, and wastewater discharges.
Find PFAS Levels Near You
A simple tool allows users to:
- Enter ZIP code Find PFAS-contaminated water near me
- View local water system PFAS results
- Compare values to New Jersey & EPA standards
- See whether their system had any violations
National Resources
- EWG Interactive PFAS Map (Interactive Map: PFAS Contamination Crisis: New Data Show 9,552 Sites in 50 States)
- PFAS in US Tapwater Interactive Dashboard
- USGS PFAS Sampling Map
- EPA PFAS Analytic Tools
New Jersey–Specific Tools
- New Jersey Water Risk & Equity Map
- NJDEP Drinking Water Watch
- County-level PFAS summaries
Key Hotspots in New Jersey
South Jersey / Delaware River Region
DuPont/Chemours facilities in Gloucester and Salem Counties
Some of the highest PFNA levels ever recorded globally
Burlington County
Multiple water systems exceeding MCLs
Long history of industrial PFAS discharges
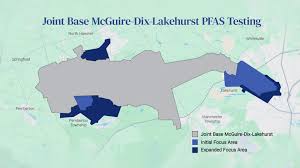
Joint Base McGuire–Dix–Lakehurst
Heavy use of firefighting foam
Groundwater contamination around military installation
Urban & Industrial Corridors (North Jersey)
Legacy chemical production
Dense industrial activities along I-95
Environmental Justice: Who Is Most Impacted?
Research shows that PFAS contamination does not affect all New Jersey communities equally. Recent NJDEP data highlight clear disparities in exposure and vulnerability.
- 2019–2021 NJDEP Data Highlights: 63% of community water systems (CWSs) had PFAS detections.These systems supply water to 84% of New Jersey residents who rely on public water.
- Disparities in Exposure: PFAS exposure disproportionately affects communities of color:92% of Hispanic residents, 94% of Black residents, 95% of Asian residents were served by water systems where PFAS was detected at least once—compared with 76% of non-Hispanic white residents.
- Overburdened Communities (OBCs):Community water systems serving OBCs were more likely to experience: PFAS detections; PFAS concentrations exceeding New Jersey’s drinking water standards; Aging infrastructure and limited access to treatment upgrades
Source: Mueller, Rosie & Salvatore, Derrick & Brown, Phil & Cordner, Alissa. (2024). Quantifying Disparities in Per- and Polyfluoroalkyl Substances (PFAS) Levels in Drinking Water from Overburdened Communities in New Jersey, 2019-2021. Environmental health perspectives. 132. 47011. 10.1289/EHP12787.
These inequities highlight the urgent need for equitable investment, transparent public data, and community-centered solutions to ensure all New Jersey residents have access to safe drinking water.